Find out why
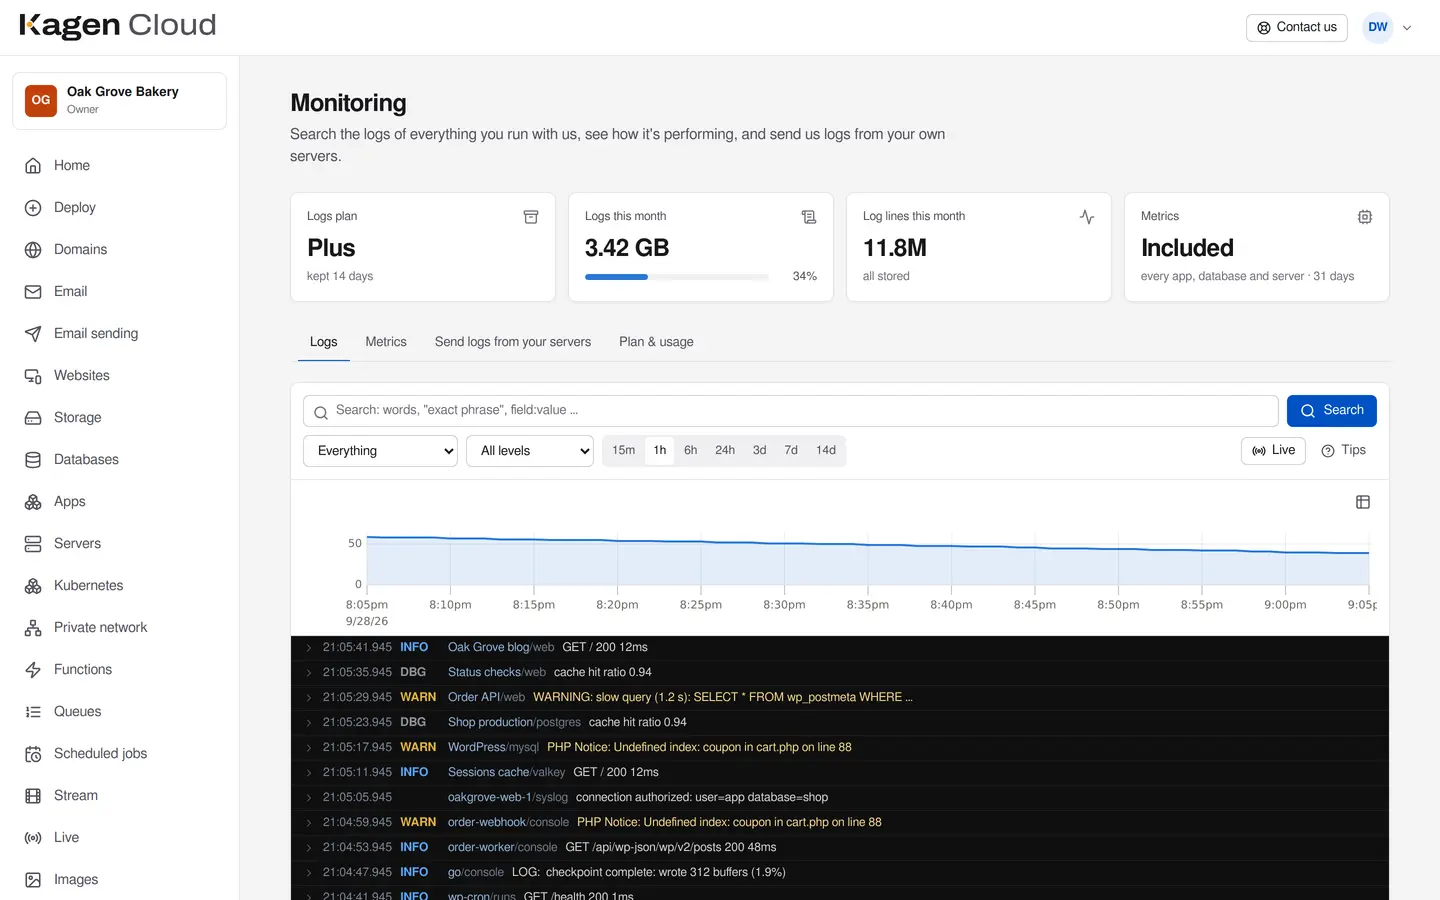
Search every app and database's logs at once, by words, phrases or fields.
Logs & metrics
Every line your apps, databases, functions and jobs write lands in one searchable place, with a live tail and a chart of what's happening. Send logs from your own servers too. Charts for CPU, memory, requests and more are included for everything you run.
Free to start
Questions? Call 817-422-8663 and talk to the person who runs it.
Who it's for
Search every app and database's logs at once, by words, phrases or fields.
Vector, Fluent Bit, Grafana Alloy, Filebeat or OpenTelemetry, with an ingest key.
CPU, memory, network and disk for apps, databases and servers, kept 31 days.
Features
Words, phrases, field:value and filters across every app, database, function and server.
Watch lines arrive as they're written, filtered to what you care about.
Send logs in with the tools you already use and an ingest key.
Values that look like passwords, API keys or tokens are masked before anything is stored.
CPU, memory, network, disk, requests and response time for everything you run, every 15 seconds.
3 days on the free plan, 14 or 30 days on Plus and Pro.
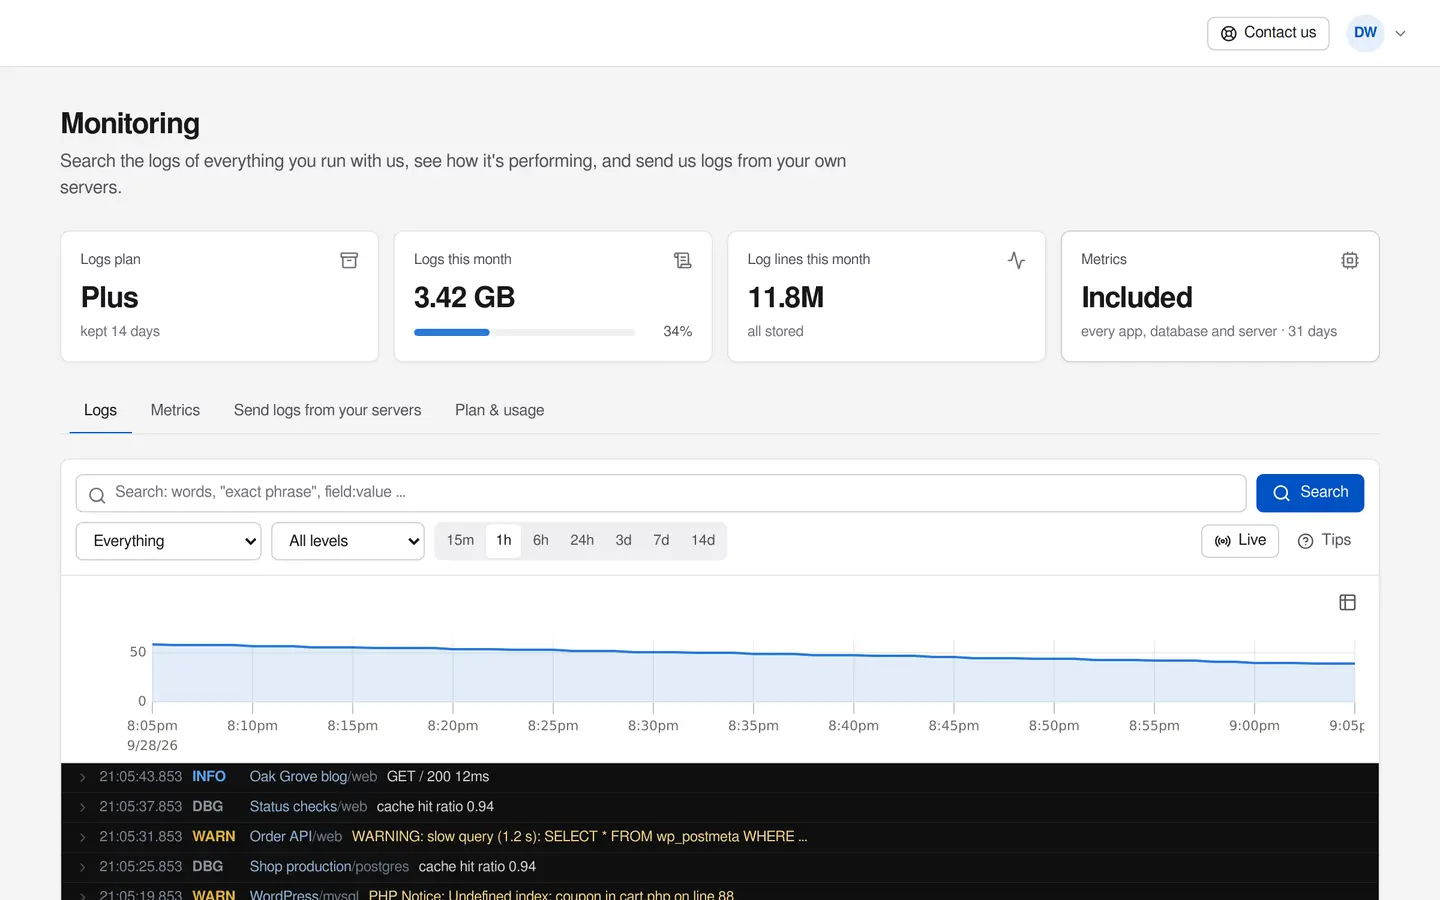
Pick an app, a database, a server or a function and see how it's doing, at 15-second resolution, for the last 31 days. No setup.
Pricing
From our live price list, the same one your invoice uses. Prices in US dollars.
| What | Price |
|---|---|
| Logs Basic3 days of searchable logs, 1 GB a month. | Freeincluded |
| Logs Plus14 days of searchable logs, 10 GB a month included. | $5a month |
| Logs Pro30 days of searchable logs, 50 GB a month included. | $15a month |
| Logs beyond your planOnly if you send more than the plan includes. | $0.40per GB |
Every price, and a cost estimator Prices as of September 28, 2026. The portal shows the current price before you create anything.
No. Logs from apps, databases, functions and jobs arrive on their own. Only your own servers need a shipper, and the portal gives you the config.
Each plan has a monthly amount included and a cap, so a chatty app can't run up a bill. The portal shows how much you've used.
Any time. Moving down hides older lines straight away; moving up keeps everything from then on.
No. Every account's logs are kept apart, and searches only ever see your own.
Call 817-422-8663 or send a request. A person answers, usually the same day.